
Products
Solutions
Resources
9977 N 90th Street, Suite 250 Scottsdale, AZ 85258 | 1-800-637-7496
© 2024 InEight, Inc. All Rights Reserved | Privacy Statement | Terms of Service | Cookie Policy | Do not sell/share my information

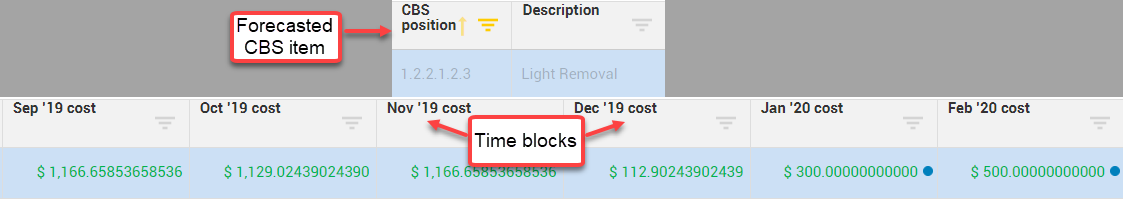
One way to mitigate this is to take the forecast and break it down into more consumable, estimate related time blocks/periods, as shown in the screenshot below. This prompts the project engineers to think about what activities, bills, and costs are going to occur in smaller more mentally digestible time periods.
Projects need to spread their estimate by periods to verify forecast accuracy vs. the actuals spent within that period. One of the key goals of time phased forecasting is to see when you are forecasting to spend allocated budget. You can then determine how accurate your forecast was versus the actuals spent within that period. Based on forecast accuracy, this gives you the opportunity to make manual adjustments within the Time phased forecasting register. It also provides the ability to have the system automatically distribute the forecast for you based upon certain criteria.
TPF gives you visibility into when you are going to spend dollars associated to a cost item in monthly time periods. TPF also helps with cash flow, enabling customers to provide more insight into how much money they need to pay employees and other bills.
After selecting a cost item from the CBS, TPF can be accessed from Control > Workspaces > Actions > Time phased forecasting. This is only if the project settings for TPF is enabled under the Forecast section.

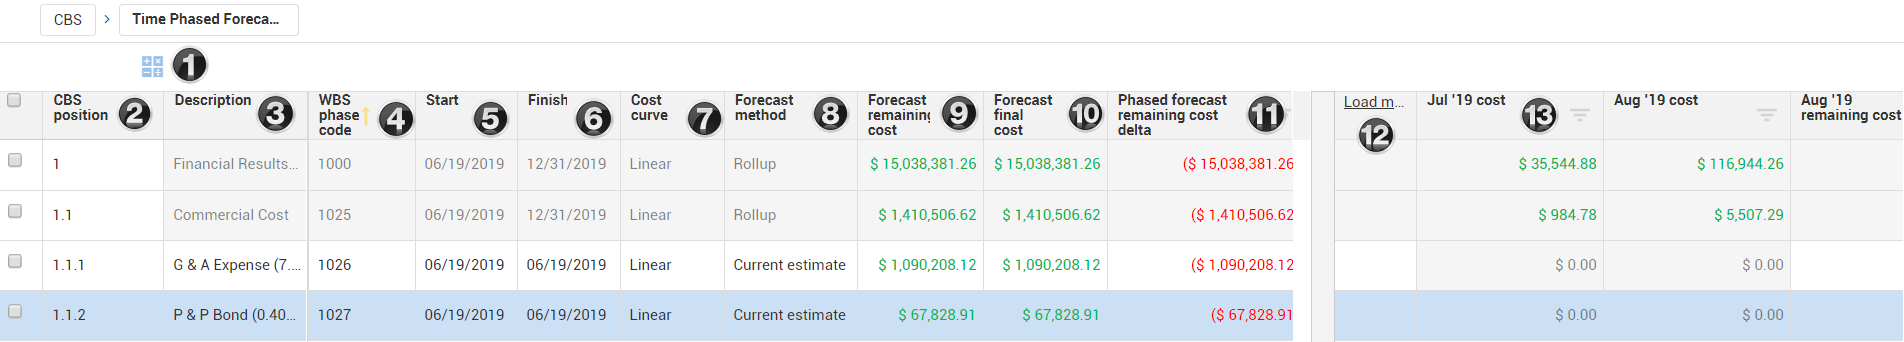
The table below shows the columns from the Time Phased Forecasting page.
|
Resource |
Description |
|
|---|---|---|
|
1 |
Auto Distribute remaining forecast based on cost curve and start/end dates
|
This will automatically distribute remaining forecast based on the cost curve being used, in addition to the Start and Finish dates. |
|
2 |
CBS position |
The CBS position identifier number. |
|
3 |
Description |
The description of the CBS. |
|
4 |
WBS Phase code |
Work Breakdown Structure code number. |
|
5 |
Start |
This is the scheduled start date for the cost item. |
|
6 |
Finish |
This is the scheduled finish date for the cost item. |
|
7 |
Cost Curve |
This is a graph/calculation of the costs of production as a function of total quantity produced. Cost curves can be created, viewed and maintained in Settings > Control > Schedule, in the Cost Curves section on the page. |
|
8 |
Forecast method |
Forecast methods include: Current Budget, Current Estimate, Average Performance, Manual (EAC), None, and Rollup. |
|
9 |
Forecast remaining cost |
This is the unsettled balance of forecast. Cost that is projected to still be required to be paid out (varies depending on forecast method). |
|
10 |
Forecast final cost |
Total cost to date + Forecast remaining cost, cost item projected total cost at completion. |
|
11 |
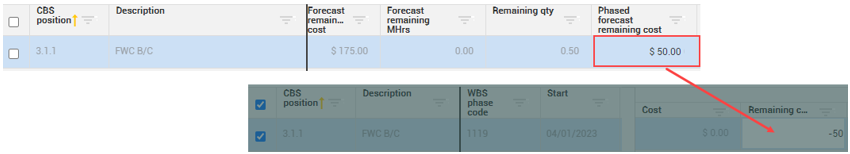
Phased Forecast Remaining Cost Delta |
This is the remaining forecasted cost that has not yet been allocated to a monthly period. It is the difference between the Forecast remaining cost and the sum of forecasted cost currently represented in all remaining months on the TPF window. |
|
12 |
Load more |
This will load additional month columns to view in the TPF window. |
|
13 |
<date> cost |
The forecasted cost projected to be incurred during that individual month. |
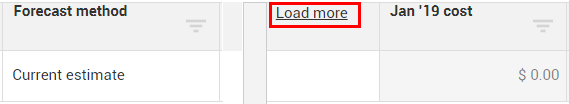
There is a Load More column that exists in the middle/top of the page. When selected, additional monthly time buckets will be added to the page.
The Time phased forecasting register allows you to time phase auto spread forecast remaining costs, which are based on cost curves, and start/end dates. You can also manually override specific months and change the distribution costs.
For example: you have $250,000 to spend on a cost item (Forecast remaining cost). You can use Time Phased Forecasting to spread your dollars into monthly allocation buckets. This can be done by automatically spreading the $250,000 forecast, or by manually overriding the forecast and entering your own values into the monthly buckets.

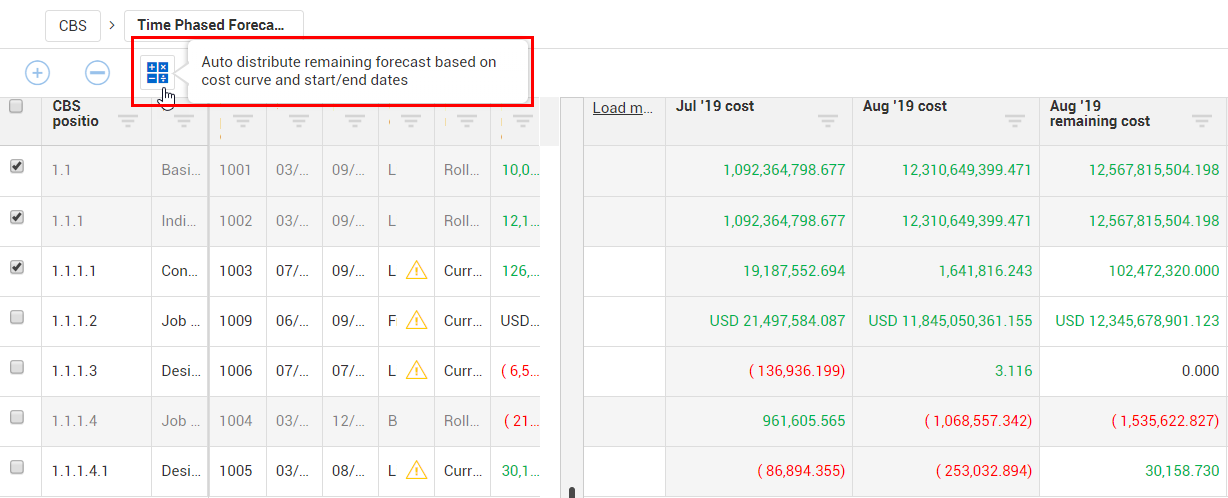
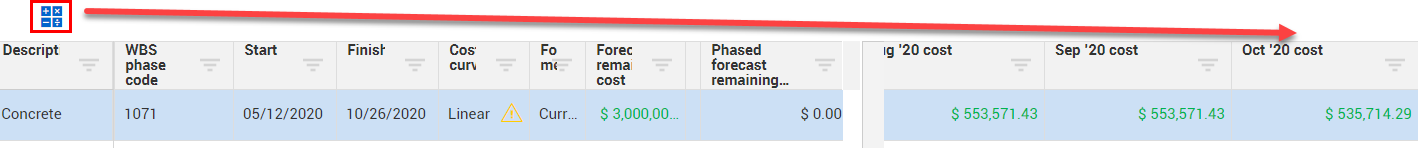
The Auto distribute icon allows you to have the system automatically allocate remaining forecast as determined by your Actual Start date, Actual Finish date, and Cost Curve.
The Auto distribute icon allows you to automatically distribute dollars into monthly allocation buckets. In this case, the allocating of dollars will begin on the Start date of May 2020 and stop allocating on Finish date month of October of 2020.
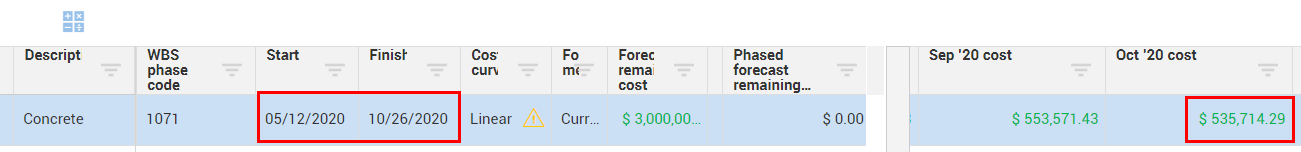
Using the same example, it’s also possible to manually forecast the allotted $3,000 into your desired monthly buckets. By manually entering in $400,000.00 into the Oct 2020 bucket, your Phased forecast remaining cost delta changes to $135,714.29. This represents the remaining amount of dollars to still be forecasted.

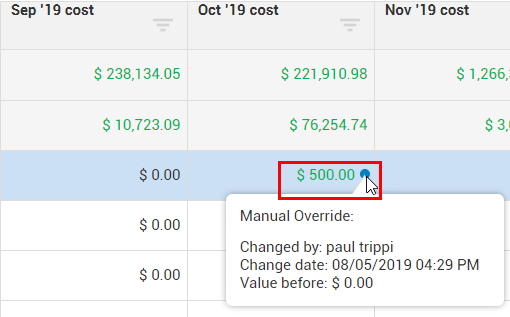
On the right side of the screen, a blue circle displays by the forecast quantity when a manual override to the forecast quantity is performed. If you hover over the blue circle, it shows a description of the manual override.
On the left side of the screen, a manual override to the forecast amount shows a warning symbol by the cost curve. Hovering over the warning sign shows that the cost item contains a manual change to the time phased months, and thus, the cost curve is no longer accurate.

In addition to Cost, Man hours and Quantity displays on the Time phased forecast grid. If you manually adjusted the cost for one of the months in the grid, a dialog box appears asking to proportionally adjust Man hours and the Quantity.

If for example you doubled your cost in the Time phased forecast, it would also proportionally double your Man hours or Quantity. You can view the values that the man hours and quantity would proportionally adjust to in the read only cells.
If you manually adjusted Man hours or Quantity in the Time phased forecast grid, a dialog box appears asking to proportionally adjust cost and man hours .
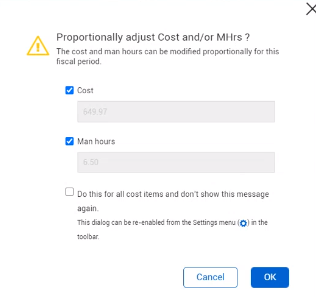
Both dialog boxes have the option to adjust proportionally without showing the message again. If you selected this option and want to revert settings back to see the dialog again, in the Time phased forecast grid, go to the Settings icon and select Enable dialogs.

In the Time phase forecast grid, you can also select to export to Excel.

Selecting this exports everything that is in your view to an Excel spreadsheet.
Static manual TPF lets you distribute a time phased forecast in the future without causing a redistribution. All values entered in the TPF are constant, and any deltas based on current month actuals that do not equal what was forecasted for that month, must be spread manually.
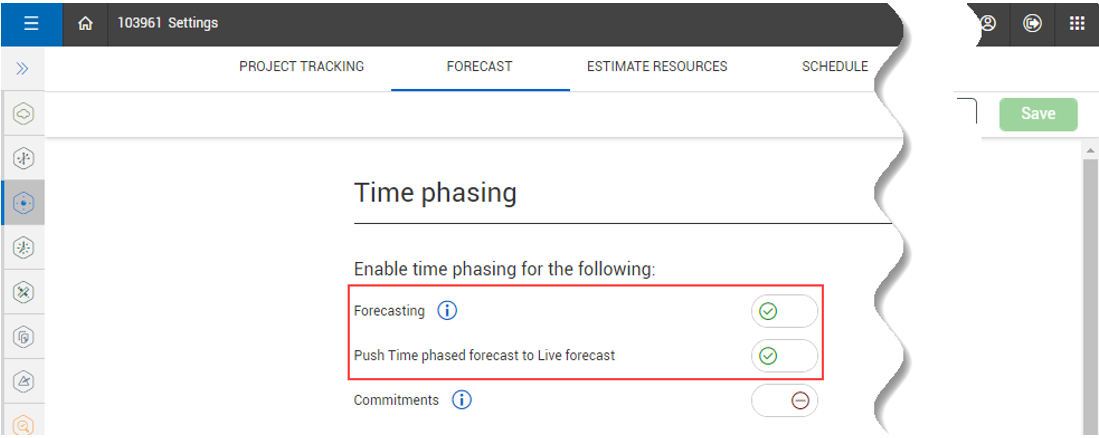
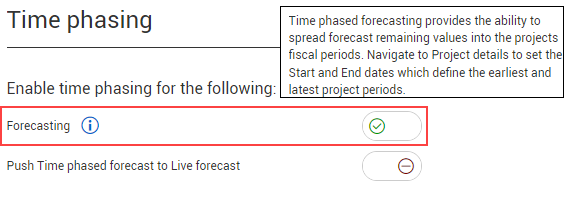
To enable the static manual forecast method, the Forecasting and Push time phased forecast to Live forecast toggles must be set to On in Settings > Control > Forecast.
The static manual forecast can be enabled on the Time phased forecasting page by first making a change to any of the distribution fields. After you click the Publish button, the Push these values to the Live forecast dialog box opens. When the Do not redistribute manual spread check box is selected, the values entered in whole months remain as-entered and are not automatically redistributed when actuals are incurred or months close.
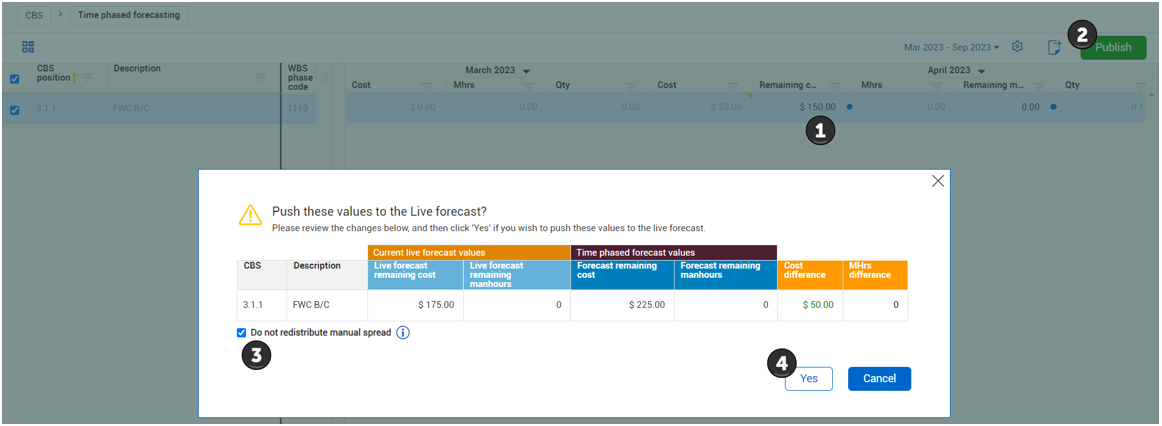
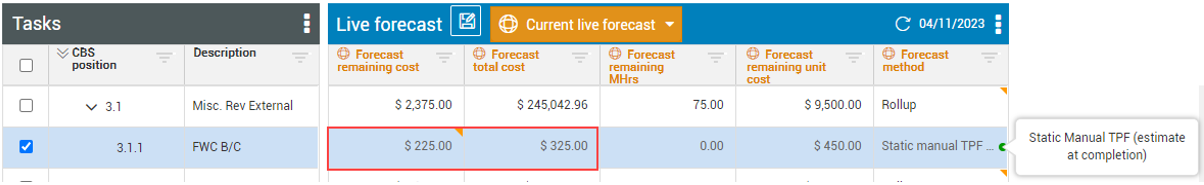
The forecast method for the CBS record automatically changes to static manual TPF, and the forecast remaining cost and forecast total cost changes based on the distribution amount adjusted in TPF.
If costs are claimed for the CBS item, the forecast total cost remains the same, but the forecast remaining cost is reduced from the claimed actual quantity.
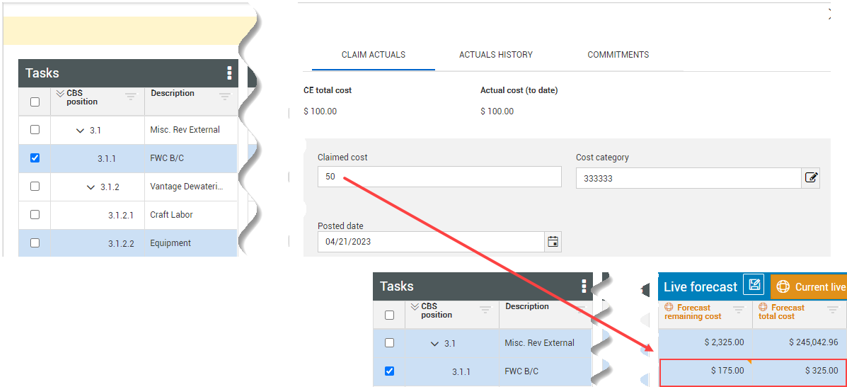
In TPF, the claimed amount now shows the phased forecast remaining cost, which represents the remaining amount that still needs to be spread. The phased forecast remaining cost now must be deducted somewhere from the TPF distribution.
Time phased forecast can be turned on in Settings > Control > Project Settings, in the Forecast section of the page.
If the setting is turned off, you will not see the Time phased forecasting option in the Actions drop-down, CBS tab, in the Control > Workspaces page.
Cost curves determine the proportion of money to be expended in a certain period of time. In the case of Time phased forecasting, the type of cost curve being used determines how forecast will be spread across the monthly forecasting buckets.
In addition, the fiscal calendar also influences how the forecast is spread.
Cost Curves are found in Settings > Control > Schedule, in the Cost Curves section of the page.

By selecting a Cost Curve and selecting the View icon, you can view its default distribution.

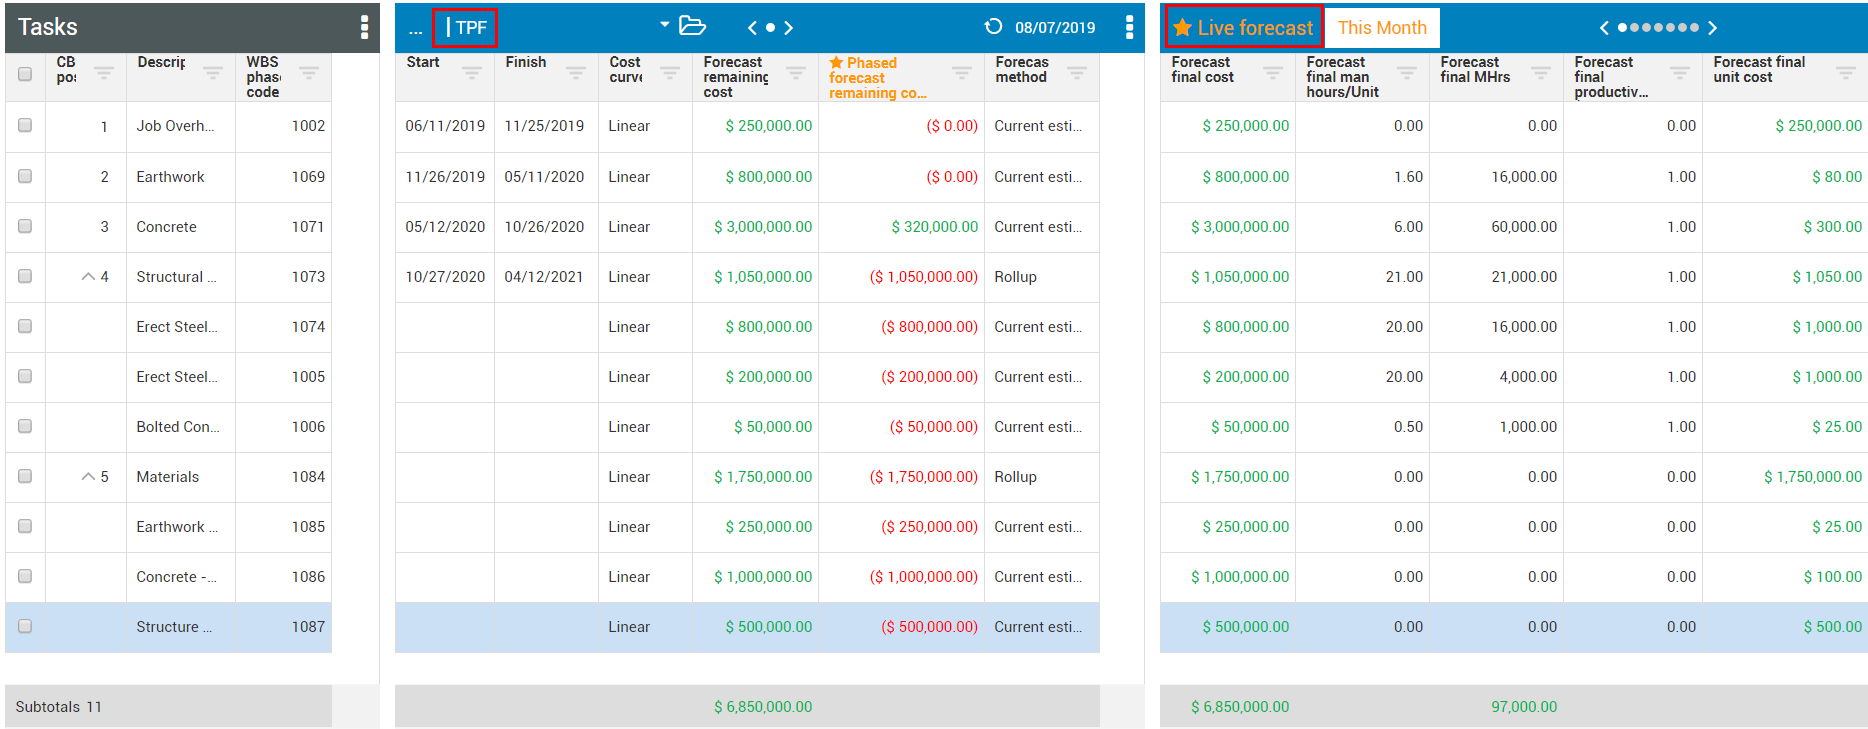
In this case, the Linear Cost Curve settings displays the cost curve durations and values.

For example, using a Linear Cost curve, with a Start Date of 05/12/2020, the Forecast Remaining cost is $3,000,000.00, with a Phased forecast remaining cost delta of $0. This means that you are forecasting to spend $3,000,000.00, and your Phased Forecast Remaining Delta is zero because your Time Phased Forecast is now fully met (you have fully forecasted $3,000.000.00).

Since your scheduled Start date is 05/12/2020, the system will start forecasting money on this cost item in May. Based on the Linear Cost curve and the fiscal calendar it will stop forecasting money in October 2020. This is based off your scheduled Finish date of 10/26/2020. Over the period of 6 months, your spend is totaling 3,000.000.00.

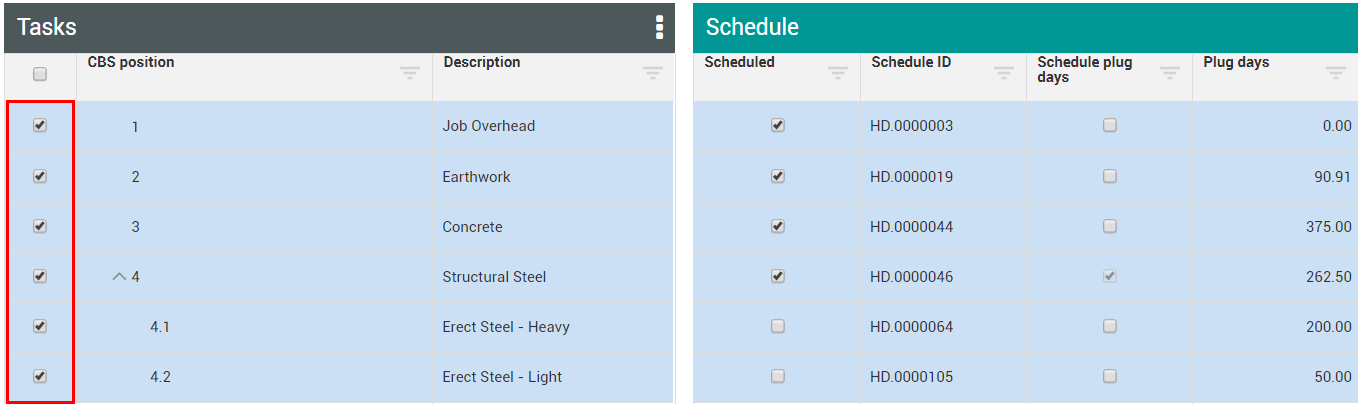
There are certain requirements for a cost item to be eligible for time phased forecasting.
The Schedule data block must have a Start and Finish date.
The Schedule data block must have a Cost curve association.
You may want to create a View in your Control Workspace similar to this one showing a Time Phased Forecast in comparison with the Live forecast. This shows the hours you are forecasting to spend money (TPF) vs. the Live forecast.
The following steps walk you through how to plan Time phased forecasting.
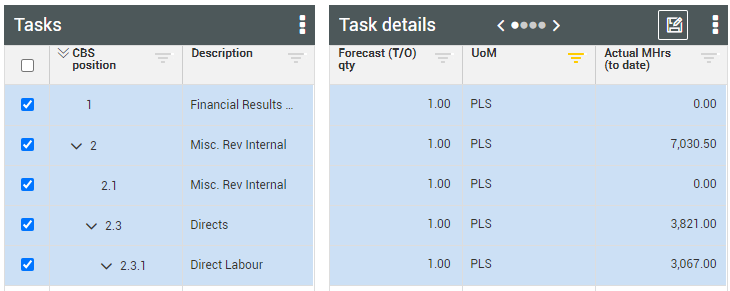
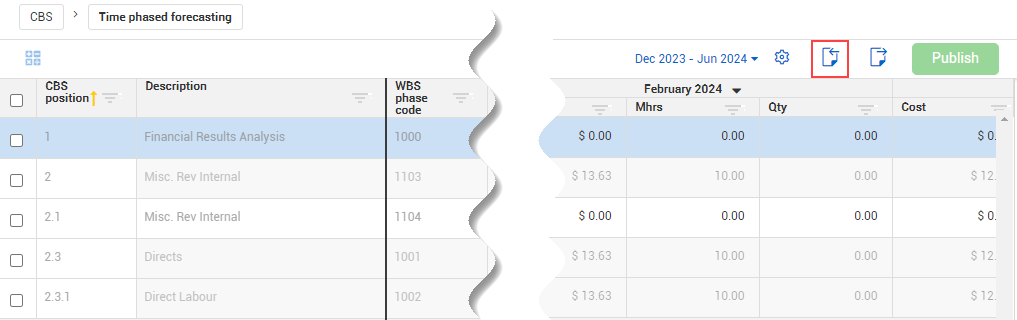
To start time phased forecasting, on the CBS tab, select your pre-determined CBS items as shown below.
Select Time phased forecasting from the Actions menu.
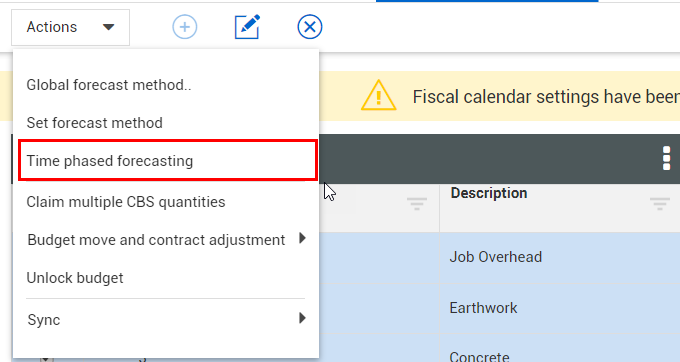
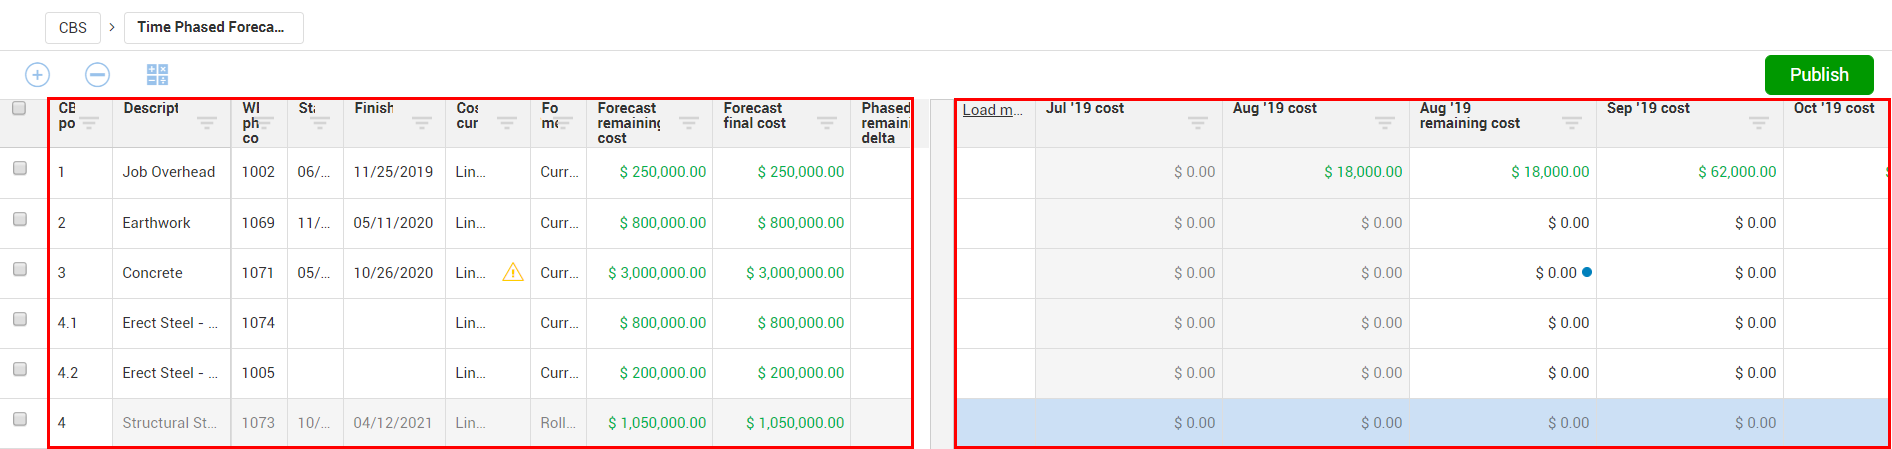
This action opens the Time Phased Forecast window, where you can see the CBS on the left side of the screen, and its associated forecasting monthly allocation cost buckets on the right
For one of your cost items, type in $500 in one of the monthly bucket fields.
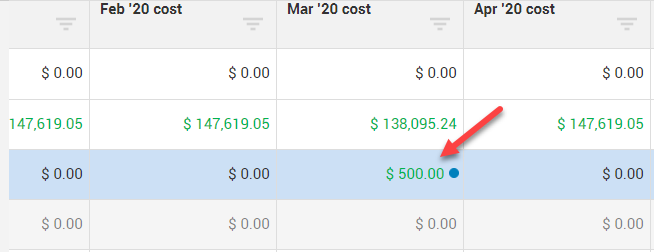
Notice how the field now has a blue circle next to the $500.00. If you hover over it, you see the value before, after, and the date the change was made

Because of the manual adjustment, a warning sign appears on the Cost curve for this cost item. The cost curve is not being changed to manual, but the system records that this cost item is no longer linear, because it has been overridden

The override made to this cost item is no longer needed, and you now decide you want to revert to its original setting, and have the system Auto distribute the forecast
Make sure your cost item is checked, then select the Auto distribute icon.
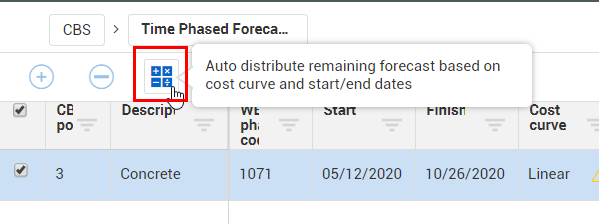
This action will revert the time phase values back to the same numbers as they were prior to any manual adjustments, plus:
It will erase any manual adjustments
It will distribute the remaining forecast values based on cost curve and start/end dates of that specific cost item, as determined by the fiscal calendar
The result of selecting the Auto distribute icon starts its forecasting spread on the cost item’s Start date of 05/12/20, and will Finish its schedule on 10/26/20
It is important to remember the purpose of utilizing Time Phase Forecasting is to see how you are forecasting to spend money over a period of time. The expectation is to get the forecast adjusted to where it should be, and update costs as needed.
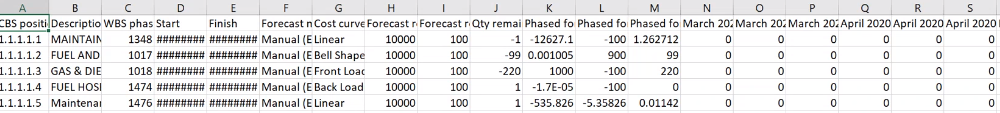
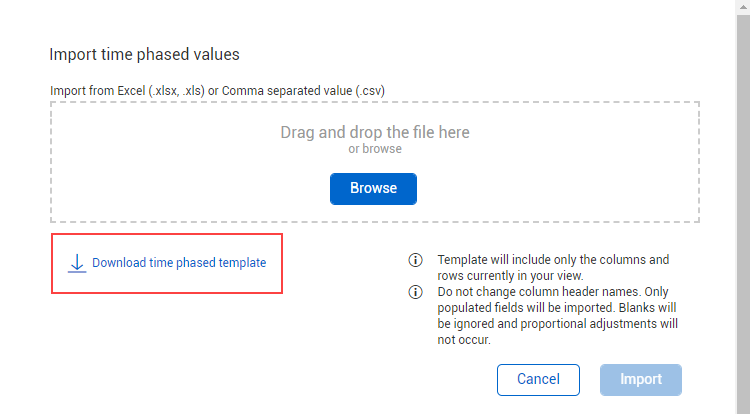
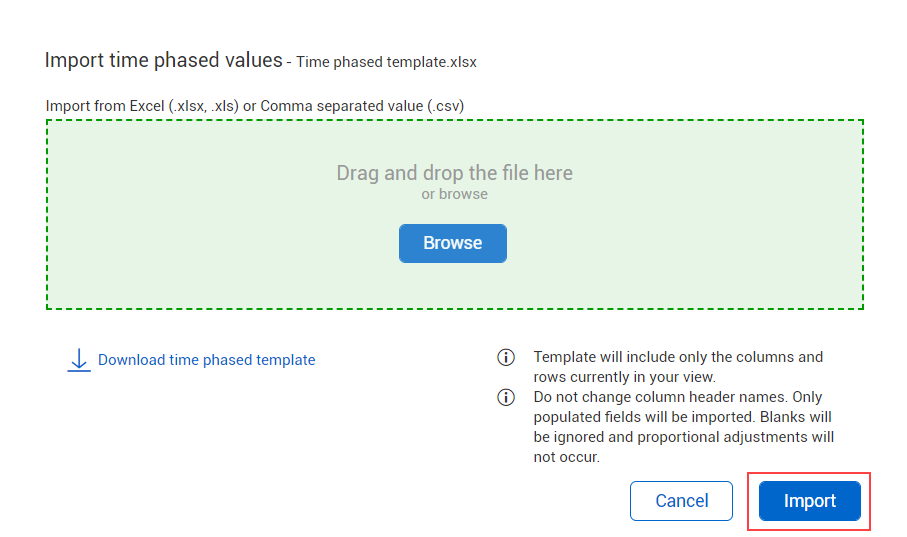
You can import a Microsoft Excel file to update the values in Time Phased Forecast by selecting Import on the Time Phased Forecast page to download the time phased template. To import time phased forecast values, you can download a template as shown in number 2 in the image below to use as a guide to import your new time phased forecast values. The same format provided in the download template is required for the import to be successful.
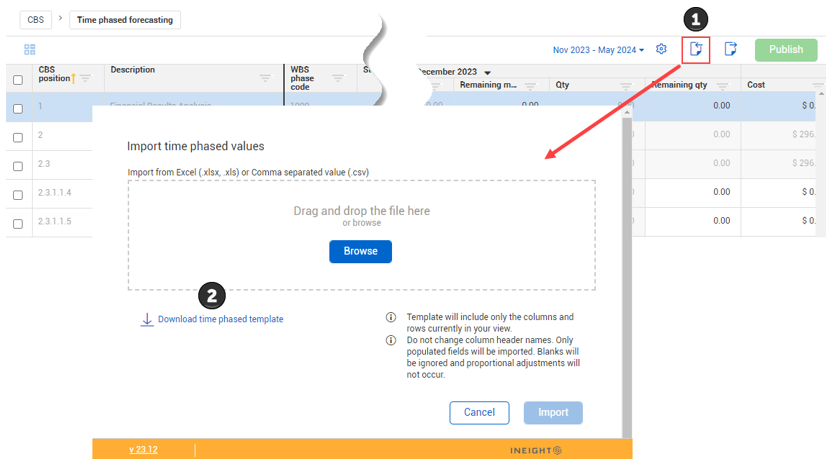
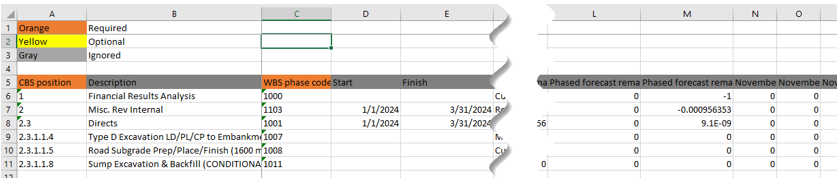
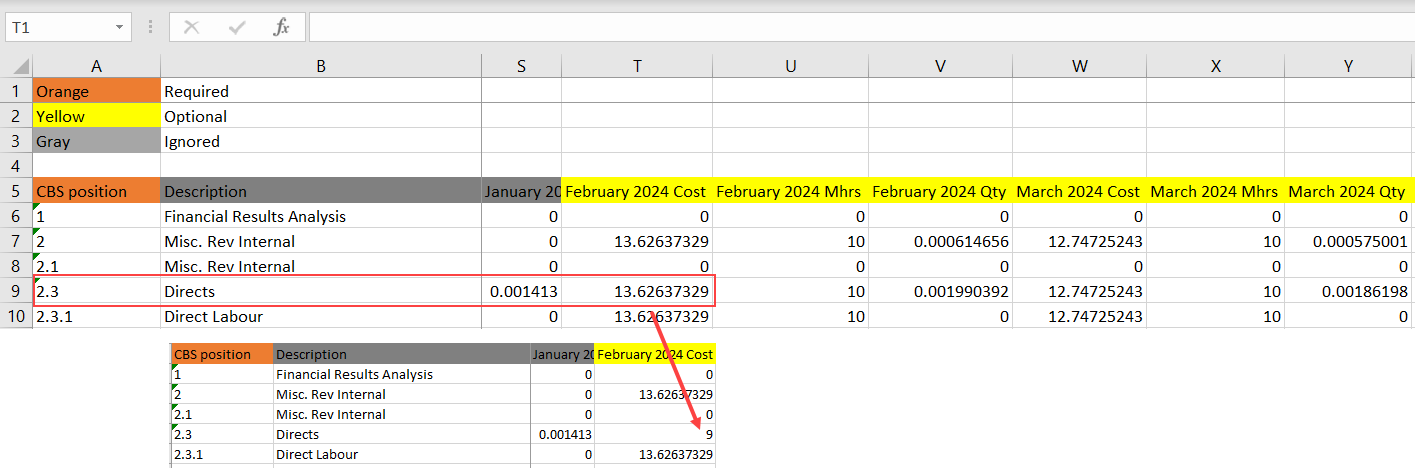
The Excel file includes the cost items that are in your current Time Phased Forecast view. Columns in orange are required, columns in yellow are optional to change, and columns in grey are ignored and cannot be changed. When you are finished making your Excel changes, you can then import the Excel file into Control to update the Time Phased Forecast with your new values. Column header names are ignored if changed.
Updates are made when you select Publish. Excel imports are shown in the Import History Audit Log, where you can download the Excel file to see a list of errors if the process fails.
To start time phased forecasting, on the CBS tab, select your pre-determined CBS items as shown below.
Select the Import icon.
Click Download time phased template.
Adjustment any of the fields under the yellow columns. For example, for CBS position 2.3, change the February 2024 Cost from 13.62637329 to 9, then save your changes.
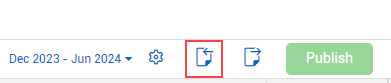
Select the Import icon again.
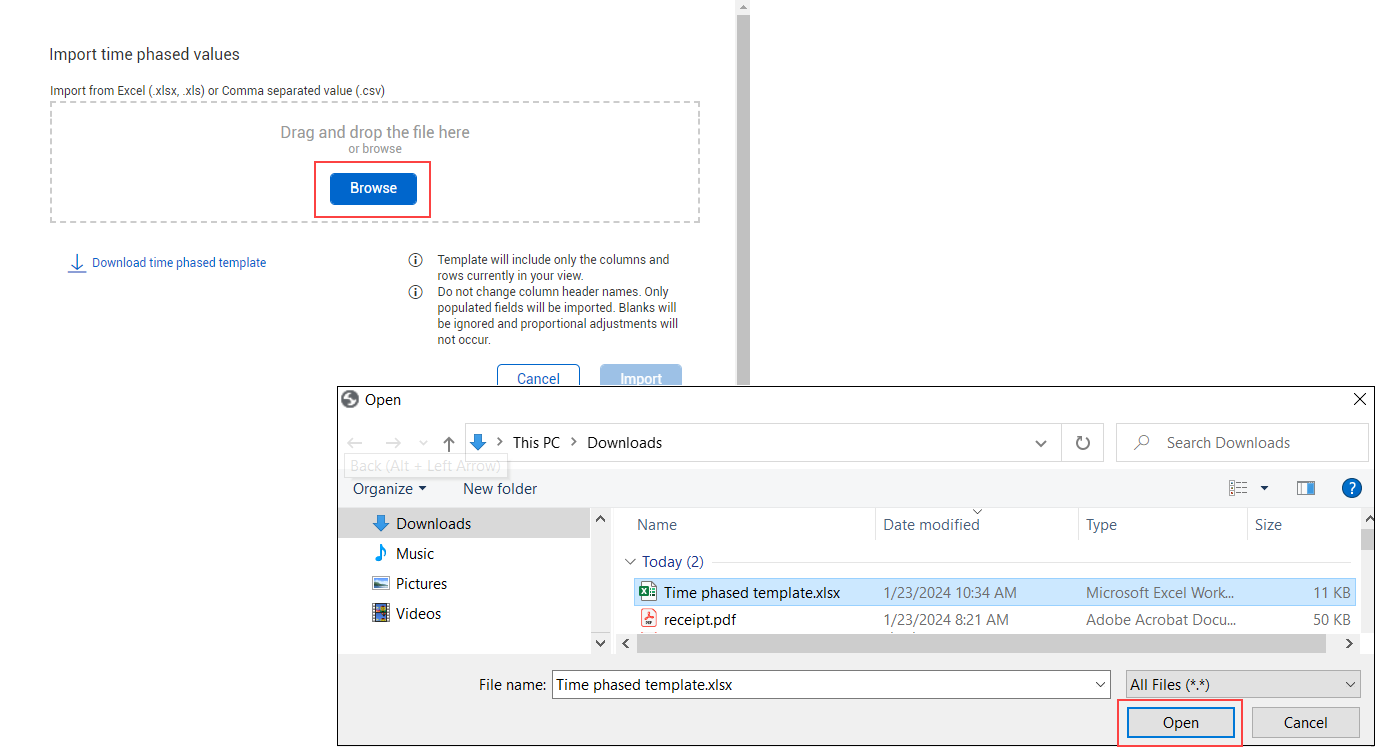
Select Browse, and then navigate to the Excel file you just saved, then select Open.
Select Import.
When you open the Time phase forecast, a column chooser has been added to the grid.

After you choose which columns to show, the left side of the grid updates with your selection.
On the right of the grid, you can also adjust your view for each month's Cost, Man hours, and Quantity. This can be done using the drop down next to the month and deselecting the options you do not want to see on your grid.

If you select cost from past dates, the data is read only.
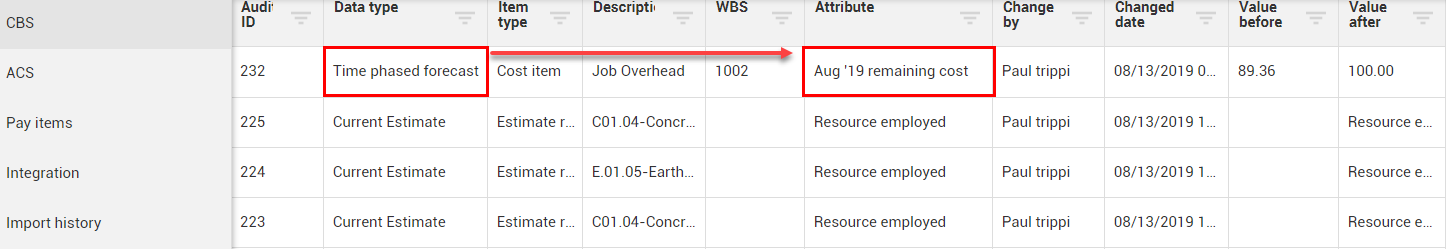
All changes made within TPF are captured in the Audit log within Control Workspaces. The Audit log captures changes based on any changes made to a forecasted CBS item.
In the example, it shows that a forecasting value was changed on 08/13/19 for Audit ID 232. The forecasting value had been changed from 89.36 to 100.00 for the Aug ’10 remaining cost time period.
Additional Information
9977 N 90th Street, Suite 250 Scottsdale, AZ 85258 | 1-800-637-7496
© 2024 InEight, Inc. All Rights Reserved | Privacy Statement | Terms of Service | Cookie Policy | Do not sell/share my information